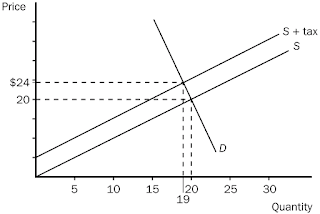
1. The market will be
in equilibrium with a tax on sales of a good when
a. the quantity
demanded equals the quantity supplied and the price buyers pay exceeds the
price sellers receive by the per-unit tax.
b. the price received
by the seller equals the price paid by the buyer and the quantity demanded is
less than the quantity supplied by the amount of the tax.
c. the tax is equal
to the price paid by the buyer and quantity demanded is equal to the quantity supplied.
d. there cannot be a
market equilibrium with a tax on sales.
2. The tax rate on a
good is the
a. total amount of
taxes paid by consumers on that good.
b. total amount of
taxes paid by producers on that good.
c. total amount of
taxes paid by both producers and consumers on that good.
d. per-unit tax on a
good, expressed as a percentage of its price.
3. Deadweight loss
a. means that there
is a loss to some individuals without a corresponding gain to others.
b. is not really a
loss to society because what one individual loses another individual gains.
c. can be eliminated
by sales taxes.
d. can occur even if
output is at the efficient level.
4. Deadweight loss
measures the
a. the amount people
would pay to gain an additional unit of a good.
b. the loss from
economic inefficiency.
c. the difference
between two efficient situations.
d. the amount
required to compensate producers for lost surplus due to the imposition of a
sales tax.
5. The deadweight
loss from an economically inefficient situation is equal to
a. consumer surplus
minus producer surplus.
b. consumer surplus
plus producer surplus.
c. the consumer and
producer surplus that people could gain by eliminating that inefficiency.
d. the increase in
consumer surplus minus the increase in producer surplus that people could gain
by eliminating that inefficiency.
6. A per-unit tax on
a good creates deadweight loss because
a. it makes demand
more inelastic.
b. it makes supply
more elastic.
c. by increasing the
price consumers pay, and reducing the price sellers receive, it prevents some
mutually beneficial trades.
d. the government
wastes the tax revenues it receives.
7. Consider the
impact of a tax in the market described in this diagram. The equilibrium price
and quantity exchanged in the market before the tax is
a. $100 and 25 units.
b. $20 and 20 units.
c. $19 and 20 units.
d. $0 and 25 units.

8. Consider the
impact of a tax in the market described in this diagram. The equilibrium price
and quantity exchanged in the market after the tax is
a. $100 and 25 units.
b. $20 and 20 units.
c. $24 and 19 units.
d. $19 and 19 units.
9. Consider the
impact of a tax in the market described in this diagram. The deadweight loss
attributable to the tax is
a. 2.5.
b. 5.0.
c. 95.
d. 97.5.
10. Consider the
impact of a tax in the market described in this diagram. The government will
collect
a. $100.
b. $95.
c. $50.
d. no money,
consumers will refuse to buy this good with the $5 tax.
11. If the supply
curve is perfectly elastic, a per-unit tax
a. does not create a
deadweight loss.
b. does not reduce
consumer surplus.
c. does not reduce
producer surplus.
d. reduces consumer
surplus but increases producer surplus.
12. Suppose demand
for electricity is perfectly inelastic. A tax on electricity will be
a. split between producers
and consumers in equal shares.
b. paid only by
producers.
c. paid only by
consumers.
d. split between
producers and consumers in unequal shares.
13. The coastal town
of Milford, Connecticut recently increased taxes on beachfront property. They
did this because
a. taxes on land
generate no deadweight loss and lots of revenues for government.
b. politicians
recognize that the supply of beachfront property is perfectly inelastic and so
the tax would generate no deadweight loss.
c. taxes on land are
paid entirely by the suppliers since the supply of beachfront property is
perfectly inelastic.
d. All of the above
are correct.
14. When the
government increases taxes on labor income,
a. people tend to
work harder to make up for lost income.
b. people tend to
work less because their take-home wage is lower.
c. most employers
reduce employment.
d. Any of the above
are correct, depending on the elasticities of demand and supply.
15. Which of the
following groups has a relatively elastic supply of labor?
a. heads-of-households
who must support other people with their incomes
b. elderly people on
Social Security, who can choose whether or not to work
c. second earners in
a household, who make lower wages than the primary wage earner.
d. B and C both have
relatively elastic labor supplies.
16. Which of the
following groups has a relatively inelastic supply of labor?
a. heads-of-households
who must support other people with their incomes.
b. Elderly people on
Social Security, who can choose whether or not to work.
c. second earners in
a household, who make lower wages than the primary wage earner
d. B and C, who have
relatively elastic labor supplies
17. Henry George’s
arguments were based on the idea that
a. income taxes are
optimal because they distort incentives.
b. income taxes are
optimal because they create no deadweight loss.
c. taxes on land are
optimal because they create no deadweight loss.
d. income taxes are
optimal because they are paid by employers.
18. According to
supply-side economists, the U.S. tax system tends to
a. decrease interest
rates and loans to businesses.
b. dampen incentives
to work, save, and invest.
c. reduce
unemployment and push up the price level.
d. provide lower tax
rates to people who work on salary.
19. According to the
Laffer Curve, when taxes are increased from 0 percent to a rate consistent with
the maximum point on the curve, tax revenue will
a. decrease.
b. increase.
c. be the same as the
tax rate.
d. remain constant.
20. According to
supply-side economists, a policy that __________ will cause productivity to
increase, which increases the supply of goods and services in the marketplace.
a. increases interest
rates
b. decreases
inflation
c. reduces marginal
tax rates
d. funds capital
investment in the economy
21. In the early
1980s, supply-side economists suggested that the U.S. was at
a. the minimum point
along its Laffer curve.
b. the maximum point
along its Laffer curve.
c. some point along
the rising portion of its Laffer curve.
d. some point along
the falling portion of its Laffer curve.
22. Consider these
diagrams. Which shows the greatest deadweight loss to its tax?
a. A
b. B
c. C
d. D

23. Consider these diagrams.
Which shows no deadweight loss to its tax?
a. A
b. B
c. C
d. D
24. The hypothesis of
the supply-siders was disputed by data from the 1980s that showed
a. decreases in tax
revenues when taxes were increased.
b. increases in tax
revenues when taxes were increased.
c. decreases in tax
revenue when taxes were decreased.
d. increases in tax
revenues when property taxes were increased.
25. U.S. policymakers
disagree most often about the effects of taxation because
a. some are
capitalists and some are communists.
b. some are
supply-siders and some are not.
c. they have
different ideas about the relative elasticities of demand and supply.
d. some are rich and
some are poor.
No comments